Designinig Data-Intensive Applications
Summary
- 延迟和响应时间
- 响应时间是请求到响应时间,包括一些延迟,像网络、队列延迟
- 延迟是请求
等待处理的时间 - 衡量响应时间不应该是单次请求消耗的时间数值。要一组数值才对,每次同样的请求所消耗的时间也不一样。
- 怎么衡量响应时间的度量呢?
- 不要用响应的平均值来度量,它并不能代表用户的实际情况。
- 百分比?
- 处理负载
- 垂直扩展:
- 横向扩展:
Reliable, Scalable, and Maintainable Applications
Latency and response time
- Response time is what the client sees: besides the actual time to process the requeset(the service time), it includes network delays and queueing delays.
- Latency is the duration that request is waitinig to be handled——during which it is latent, waiting serivce.
- In practice, in a system handling a variety of requests, the response time can vary a lot.We therefore need to to think of response time not as a single number, but a as a
distribution of valuesthat you can measure.

Figure 1-4. Illustrating mean and percentiles: response times for a sample of 100 requests to a service.
- Most request are reasonably fast, but there are occasional outliers that take much longer.
- Perhaps the slow requests are intrinsically more expensive,e.g., because they process more data. But event in a scenario where you’d think all request should take the same time, you get variation: random additional latency could be introduced by a context switch to background process, the loss of a network packet and TCP retransimission, a garbage collection pause, a page fault forcing a read from disk, mechaincal virations in the server rack, or many other causes.
响应时间用平均值做为指标,并不是好的选择
- “average” doesn’t refer to any particular formula, but in practice it is usually understood as the arithmetic mean. However, the mean is not a very good metric if you want to know your “typical” response time, because it doesn’t tell you how many users actually experienced that delay.
用百分位数:从最快到最慢排序,取中间 rt
- Usually it better to use
percentiles. If you take your list of response times and sort it from fastet to slowest, then the median is the halfway point: for example, if your median response time is 200 ms, that means half your request return in less than 200ms, and halt your rquest take long than that. - The mediam is aka.
50 th percentile, and sometimes abbrieviated as p50.Note that the median refers to a single request; if the user makes several request(over the course of a session, or bacuase severak resouces are included in a single page), the probability that at least one of them is slower than the median is much greater than 50% - High percentiles of response times, as know as
tail latenciesare important because they directly affect user’s experience of the service. (高百分比的称为”尾部延迟“)
Amazon has observed that a 100 ms increase in response time reduces sales by 1%()
Approaches for Coping with Load
-
An architecture that is appropriate for one level of load is unlikely to cope with 10 time that load. if you are working on a fast-growing service, it is therefore likely that you will need to rethink your architecutre on every order of magnitude load increase or perhaps even more foat then that.
-
Scaling Up and Scaling Out :
-
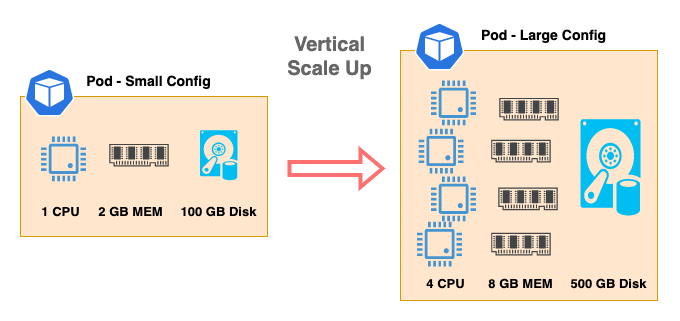
scaling up: vertical scaling, moving to a more powerful machine
-
scaling out: horizontal scaling,distributing the load across multiple smaller machines.
-
Scaling up (or vertical scaling) is adding more resources—like CPU, memory, and disk—to increase more compute power and storage capacity.
Scaling out (or horizontal scaling) addresses some of the limitations of the scale up method. With horizontal scaling, the compute resource limitations from physical hardware are no longer the issue.


